Changes in opioid utilization correlated with state-level policy changes aimed at decreasing opioid prescription rates.
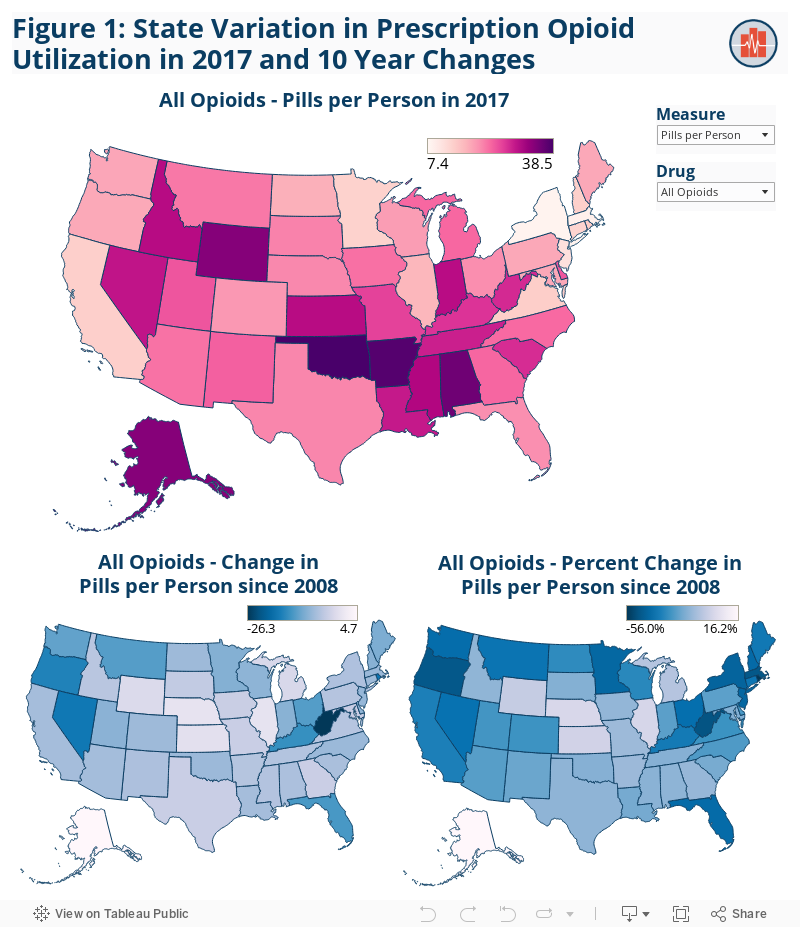
Previous research by HCCI illustrated that national opioid utilization in pills per person fell 27% between the years of 2008 and 2017, driven by declines in the use of hydrocodone (Vicodin). In addition to giving insight into prescription opioid utilization by the commercially insured, the blog also features an interactive tool that allows users to view utilization by state. In this companion piece, we explore the state-level geographic variation with interactive maps. Given ongoing state-level policy efforts to impact opioid prescribing, it is instructive to see how utilization varies year to year among states.
To explore this variation in opioid use, we developed an interactive map that shows the percent change in opioid pills per person. The map tracks hydrocodone, oxycodone short acting, tramadol and opioids overall; the former three are the most commonly prescribed opioids.
- Nearly every state had a decrease in pills per person. Some of the largest percent decreases in use were seen in Rhode Island (51%), West Virginia (48%), and Oregon (47%).
- Interventions such as prescription drug monitoring programs (PDMPs), increased provider training on opioid prescribing guidelines, and greater awareness on opioid use disorder likely affected states’ opioid prescribing patterns.
- Some states, such as Texas and Illinois, had increased use of tramadol and oxycodone short acting that coincided with decreased use in hydrocodone and oxycodone long acting.
- This provides evidence that prescribing patterns show a shift from higher-potency to lower-potency opioids for treatment of chronic pain in certain areas.
Methods Note
Using the Health Care Cost Institute claims database, we identified all individuals from 2008 to 2017 who were under 65 years of age, covered by employer-sponsored health insurance, and who did not have a cancer diagnosis or hospice claim within a year. We excluded patients who moved to different states within a month or were enrolled in multiple health plans within a month. Using the Center for Disease Control’s most current cumulative list of opioids at the National Drug Code (NDC) level, we then identified individuals with at least 1 claim. We excluded buprenorphine (used mainly to treat opioid addiction) and any opioids that did not appear in any claims from 2008 to 2017. Our denominator is average member months (total member months of all qualifying individuals within a year, divided by 12) to account for changes in year-to-year total enrollment. In the text, we refer to our utilization amount as “per person” which is the numerator of interest (aggregated sum of a specified utilization metric) divided by (average member months multiplied by 12).
Our analysis of utilization specifically measured “pills” which measures the typical number of tablets, patches, or otherwise specified delivery method supplied to patients. The other utilization metric is filled days which is the estimated amount of days a drug should last as written on a prescription label. The potency of opioids differs significantly across the commonly prescribed classes, so we also examined morphine milligram equivalents (MMEs) which standardizes strength across all opioids. MMEs are calculated by multiplying the (units of drug) by the (gram specific strength) by the (MME conversion factor).
The ‘other’ category, which accounts for a small share of total opioid use, includes butorphanol, dihydrocodeine, hydromorphone, levorphanol, meperidine, methadone, opium, oxymorphone, pentazocine, propoxyphene, and tapentadol. Drug categories display the combined results for the short acting and long acting prescriptions for all opioids except oxycodone. The major change in composition of the other category from 2008 to 2011 was the elimination of propoxyphene in November 2010 due to unintended cardiac issues related to the drug.
Data was suppressed at the state level for Hawaii and Vermont due to low data availability. Certain drug categories were condensed into the “other” category for states where opioid utilizer counts were low. Opioid utilization at the national level contains data from all 50 states.