HCCI often reports the prices of health care services, defined as the average amount a provider is paid for a given service based on negotiations with health care insurers. These prices typically represent a portion of charges, which are the amounts health care providers bill for the procedures they perform. The charge amount is often the starting point for negotiations between insurers and providers, which ultimately determine the prices the insurer pays and, subsequently, the out-of-pocket cost to the patient.
Typically, people with health insurance do not face a medical bill for the full charge amount, as their insurance coverage gives them access to lower negotiated prices. However, charges remain a meaningful measure of health care costs because some patients (i.e. the uninsured and the insured going out-of-network) are billed these rates. It is instructive to consider the relationship between prices and charges as the Centers for Medicare & Medicaid Services looks to finalize a proposed rule requiring hospitals to make their charges public. .
Some health care services, such as emergency room (ER) visits, are more likely to result in medical bills for the full charge amount than others. A visit to the ER is typically an unplanned event, leaving patients with little or no time to shop for the best price or check if the closest ER facility is in- or out-of-network. To complicate matters further, an ER facility can be in-network while some of the physicians working there are out-of-network. These complexities can lead to insured patients paying out-of-network prices or the full charge amounts for their trips to the ER. A recent Kaiser Family Foundation study found that nearly 1 in 5 outpatient ER visits included a claim from a out-of-network provider in 2016. Additionally, over 10% of uninsured individuals used ER services in 2013 – meaning that millions of Americans are asked to pay the full charge amount for their ER visits every year.
In May, HCCI published spending, price, and utilization trends for the five Current Procedural Terminology (CPT) codes designed to capture the level of severity and complexity of ER visits. To continue our work on this topic and specifically illustrate the price-charge relationship, in this blog post we compare ER prices to their corresponding charges from 2009 to 2016.
Key Findings:
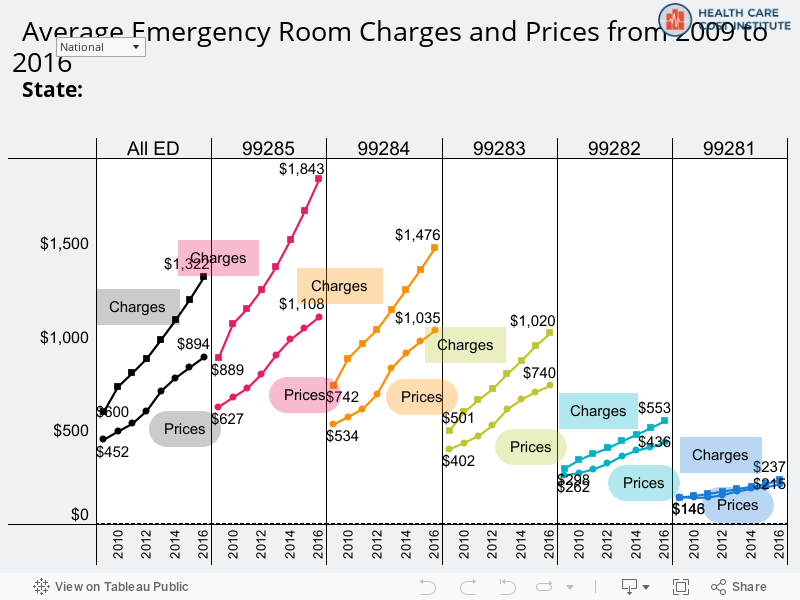
- Charges grew faster than prices for every ER visit severity level, most notably from 2009 to 2010.
- The average charge for an ER visit increased from $600 in 2009 to $1,322 in 2016; a total increase of $722, or 120%.
- oThe average charge for the highest-severity ER visit increased by $954 (107%) over the 8 years we studied – the largest growth of the 5 codes.
- The average price of an ER visit increased from $452 in 2009 to $894 in 2016; a total increase of $441, or 98%.
- Average negotiated price was 70% of average charge amount for all ER visits. This insurance discount remained relatively constant from 2009 to 2016.
- Although the higher severity level visits had the highest prices, patients paid smaller shares of the full charge amounts for those visits compared to lower severity level visits.
Use the interactive tool below to explore the trends in ER prices and charges in your state.