
HCCI recently expanded its reporting on emergency room (ER) spending trends to include the most recent data available (2016). We characterize trends in spending, price, and utilization for the five Current Procedural Terminology (CPT) codes designed to capture the level of severity and complexity of every ER visit. While average prices for all five ER CPT codes were higher in 2016 than in 2009, the average prices for higher severity codes rose at a faster rate than low severity codes. Combined with more use of the high severity codes (despite decreases in overall ER use), these price increases contributed to large spending hikes – per person spending for the two most severe codes grew by more than 100% over the seven years we studied.
We also observed that, from 2009 to 2016:
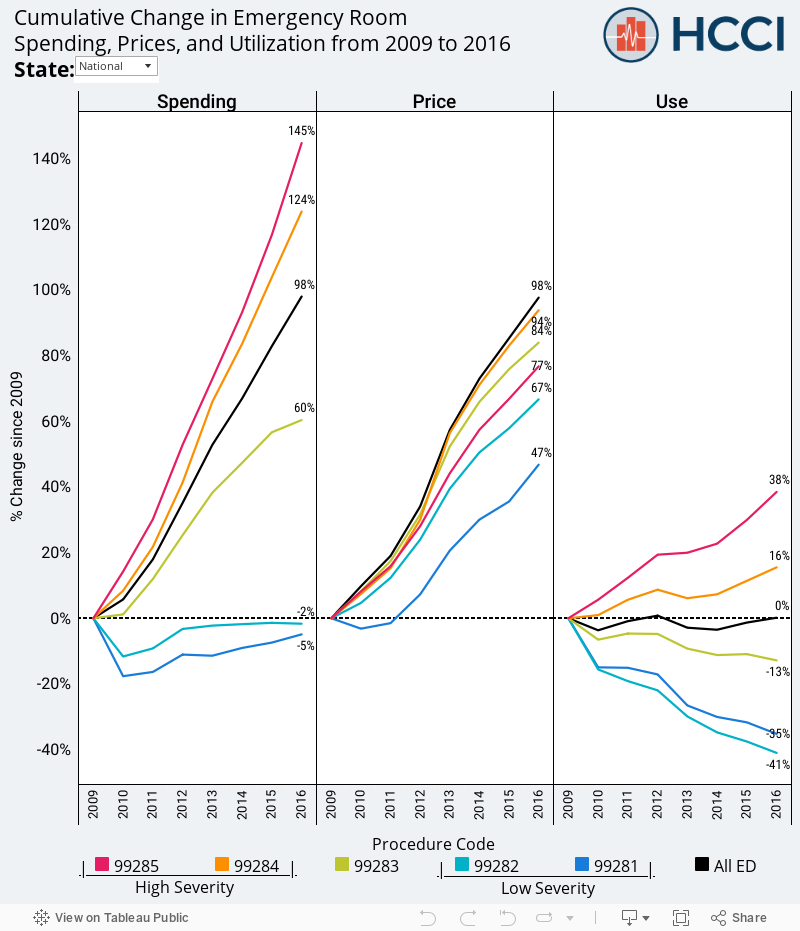
- ER visit spending per person increased 98% while overall ER use remained the same.
- Overall ER spending growth was largely driven by higher severity visits, on which spending more than doubled.
- Per person spending on the highest severity ER visit rose 145%, with price increasing 77% and use increasing 38%.
The second highest severity ER visit experienced the largest price increase of any severity level (94%) and an above average increase in utilization (16%), resulting in a 124% spending increase. HCCI is releasing a state-level downloadable data table and interactive tool to allow users to observe the ER spending, price, and utilization trends in every state and the District of Columbia. ER spending increased in every state driven primarily by higher prices and the increased use of higher severity procedure codes. State highlights:
- Mississippi had the highest overall ER spending increase, rising 153% from 2009 to 2016 – 21 states saw spending increases of over 100%
- Nevada had the highest overall ER price increase, rising 147% from 2009 to 2016 – 25 states saw price increases of 100% or more
- Between 2009 and 2016, ER use remained unchanged in 18 states, decreased in 22, and increased in 11
How to use the tool:
Use the drop-down menu in the top left corner to view ER spending trends at the national level or for any state. From left to right, the three panels of the graph show the 2009-2016 cumulative change in spending, price, and utilization trends for each of the five severity-based CPT codes for ER visits and all codes combined. Hover over the lines to view details for each year.
All the data used to construct these graphics can be downloaded here.
Methods Note
The measures reported are based on ER procedure codes (CPT codes 99281-99285) for HCCI’s ESI population. These costs represent the facility fee for an ER visit – the cost of receiving care in an ER instead of a doctor’s office. They do not include the costs of other services patients received during their visit to the ER such as the cost of an injected drug. Therefore, these price and spending measures may not capture the entirety of what is typically thought of as an ER visit. Patients may often receive multiple ER CPT codes during the same visit. The yearly proportion of visits with multiple codes remained constant throughout the study period. When aggregated to the visit level, with each visit classified as high, dual, or low severity depending on the code(s) billed, we continued to see an increase in high severity, decrease in low severity, alongside a decline in overall ER visits. Average spending and prices are calculated from the actual amount paid for each claim line containing one of the 5 ER CPT codes. The study population was limited people under the age of 65 with employer-sponsored insurance (ESI) and a non-capitated plan type. Some state level data was suppressed due to insufficient ER claims data within the HCCI dataset and in accordance with HCCI’s masking rules. Data for procedure code 99281 and 99282 are combined and reported as 99282 for Hawaii, South Dakota, and Vermont North Dakota 2016 data is not reported. For more information about the HCCI dataset and the methodology of the calculations, see the Methodology page on the HCCI website.