
Out-of-network billing practices have increasingly garnered attention as individuals with commercial health insurance continue to experience “surprise billing.” A surprise medical bill commonly describes a charge to a patient for care delivered by an out-of-network (OON) professional who works within an in-network facility. We used the Health Care Cost Institute’s (HCCI) vast commercial claims database to examine nearly 620,000 in-network inpatient admissions and all associated professional claims (both in- and out-of-network claims filed by the physician or other health care professional who rendered the service) across 37 states and the District of Columbia in 2016. Using this sample, we explore the prevalence of these surprise bills associated with in-network hospital admissions across states and medical specialties. We found:
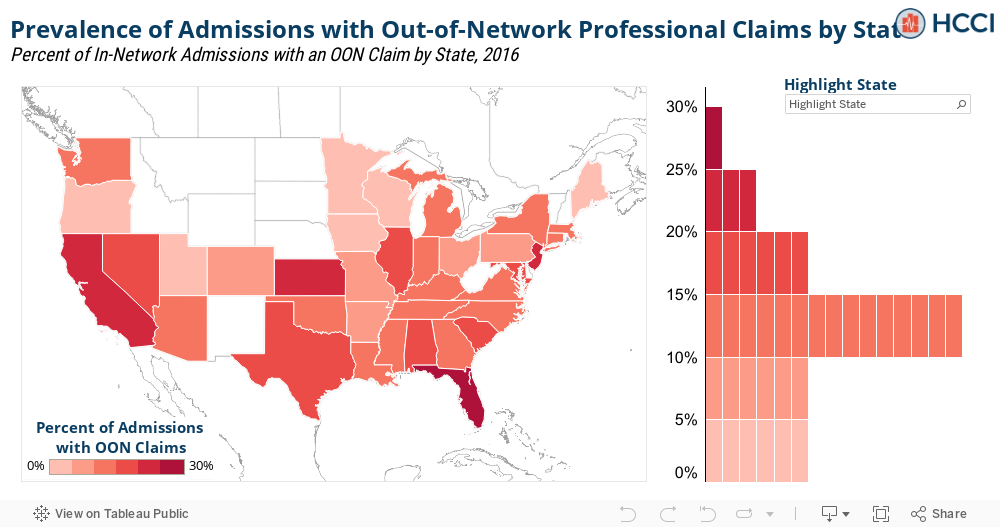
- The share of in-network hospital admissions with at least one associated out-of-network professional claim ranged from 1.7% in Minnesota to 26.3% in Florida;
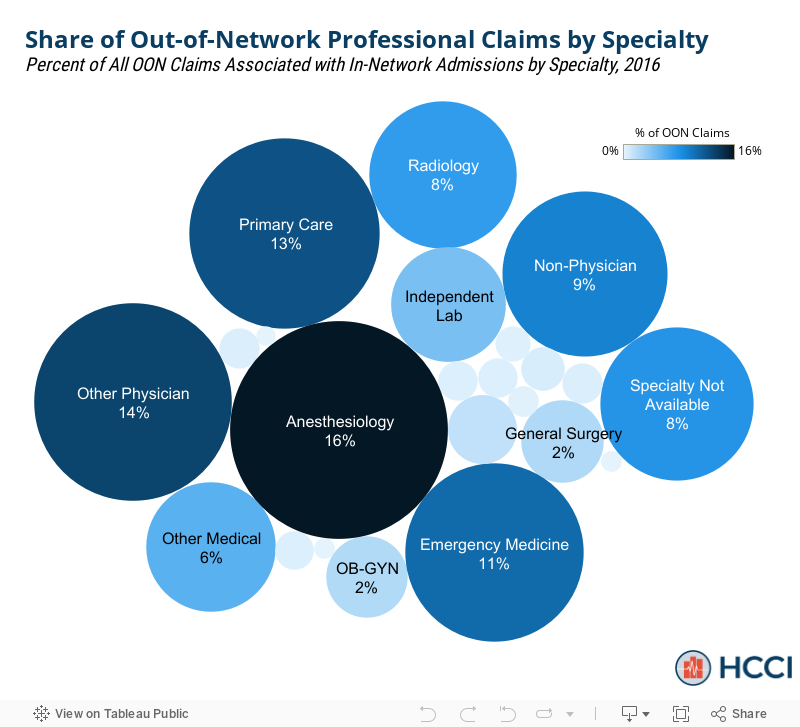
- Anesthesiology accounted for the largest share (16.5%) of out-of-network professional claims associated with an in-network admission;
- Among the specialty categories we studied, independent labs most often billed out-of-network as part of an in-network hospital admission (22.1% of the time).
In which states were in-network hospital admissions with out-of-network professional claims more common?
Overall, we found that 14.5% of these admissions had at least one associated out-of-network professional claim; that is, roughly 1 in 7 patients received a surprise bill despite obtaining care at an in-network hospital. There was fairly substantial variation in surprise billing prevalence across geographies (Figure 1). In Florida, 26.3% of the sample’s in-network admissions had an associated surprise bill – the largest percentage of any state in the study. This was over 15 times greater than in Minnesota (1.7% of admissions), the state with the lowest prevalence. To explore geographic variation in surprise billing prevalence, we mapped the percentage of in-network admissions with a surprise professional bill by state, alongside the distribution of their prevalence rates.
Which medical specialties represented the largest share of out-of-network professional claims during an in-network hospital admission?
We explored the prevalence of out-of-network billing by medical specialty in two different ways. First, we looked how all out-of-network professional claims associated with an in-network admission in our sample were distributed across medical specialties. The specialty with the largest share was anesthesiology at 16.5%, meaning that 16.5% of our sample’s out-of-network professional claims were performed by an anesthesiologist. Other notable specialties included other physician (13.5%), primary care (12.6%), and emergency medicine (11.0%).
Which medical specialties most often billed out-of-network as part of an in-network hospital admission?
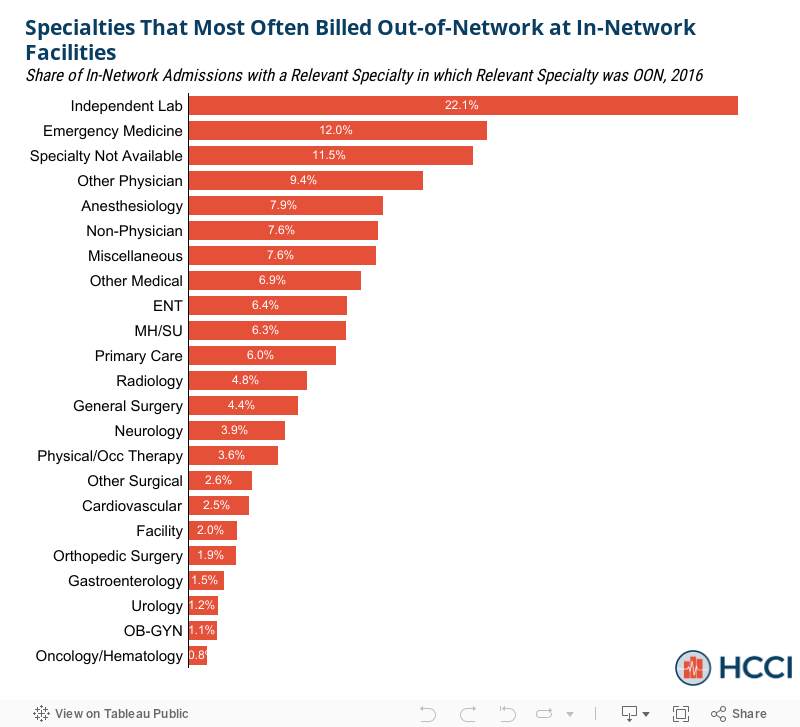
Second, we looked at how often a professional claim for each specialty was out-of-network when associated with an in-network admission. In our sample, independent lab procedures had the greatest chance of being out-of-network.
- Of the in-network admissions with an independent lab claim, 22.1% of those lab claims were out-of-network.
- Emergency medicine was the specialty with the next-highest percentage at 12.0%. Note, because our sample is limited to in-network inpatient admissions, we do not capture claims from emergency room visits where the patient was not admitted to the hospital.
- Conversely, the hematology/oncology specialty was least likely to be out-of-network as less than 1% of admissions with a hematology/oncology procedure resulted in a surprise medical bill.
The length of the bars in Figure 3 represent the likelihood of a given specialty billing out-of-network.
All the data used to construct these graphics can be downloaded here.
Methods Note
Using the HCCI commercial claims dataset, we first compiled a sample of 617,453 in-network inpatient admissions in 2016 from 37 states and the District of Columbia. To be included, the admission had to take place at a General Acute Care, non-governmental, non-military hospital and have consistent types of bill codes indicating an inpatient hospital visit. We then matched all associated professional claims to each inpatient admission based on the member and dates of admission. We flagged an inpatient admission as a surprise bill if any of its associated professional claims were out-of-network. Each professional claim was matched to a provider specialty and the source of surprise bills were identified accordingly. An inpatient admission could have out-of-network claims from multiple specialties. The miscellaneous specialty category was a combination of 17 specialties that did not have enough prevalence to report on in isolation. They were as follows: chiropractic, community support services, dental, dermatology, family practice, geriatric medicine, hearing instrument specialist, homemaker aid, internal medicine, long term acute care facility (LTAC), nurse practitioner/physician’s assistant, ophthalmology, pathology, pediatrics, podiatry, preventive medicine, and unknown.