
Annual Trends Report
Health Care Cost and Utilization Report (HCCUR)
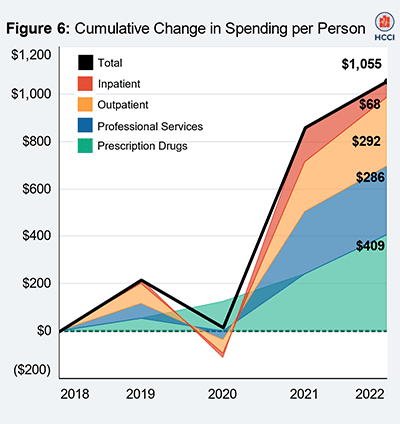
HCCI’s annual reports examine year-over-year and 5-year cumulative trends in health care spending for individuals with employer-sponsored insurance, segmented by health care service category. Downloadable tables and interactive tools allow for further exploration of the data that power these reports.
This year’s report (2018–2022) found that average annual health care spending for people with employer-sponsored insurance spending increased to $6,710 in 2022 from $5,656 in 2018. Per person health care spending increased 19% from 2018.
Methodology
Understand the methods HCCI uses to create the annual spending reports.
Data Downloads
Access the underlying data to explore spending drivers and trends.